This is an addition to the course text where I’ll take you through a brief analysis showing how we could use the tools discussed in class to address an actual research question. I’ll show the necessary code in R and possibly in Stata as well. If there are other things you want to see, please let me know! I will assume that you’ve already read the unit chapter, or at least that you understand the concepts, and will not spend a lot of time reexplaining things.
I’ll try to use data which are publicly available so that you can reproduce the results I share here.
Dataset
For this analysis, I’ll be using data from the General Social Survey, or GSS. The GSS is a survey of all adult residents of the United States of America, although other countries have similar surveys. The GSS has a complex sampling design, and requires special analytic techniques to analyze it correctly, so the results I’m going to produce will not be quite right. If you’re interested in learning more about any of these topics, or if there’s a research question you want to explore, please let me know. Although the GSS has waves of data going back to 1972, we’re going to focus on the 2022 version of the survey; at other points in the class we’ll use more of the waves.
To start with, I need to read in the data. Below you can find the code to do this in R (Stata users, if you want this translated into Stata, please let me know). If you want access to the dataset, let me know and I’ll tell you how to.
Code
# install.packages('readstata13') # I've already installed this package so I don't need to run this code. If you haven't, you should install the package before trying to library it (on the next line). But you only need to install it once.library(readstata13) # this is a package for reading in newer Stata datasetsgss <-read.dta13('gss_2022.dta') # you need to make sure that you've set the working directory to be the location where the dataset is saved
Research Questions
I’m going to be asking a few fairly simple questions: is there an association between educational attainment and attitudes towards vaccine safety? Is there an association among people who identify themselves as Democrats? Is there an association between people who identify themselves as Republicans?
Here’s my reasoning: all vaccines in use have been studied extensively and demonstrated to be safe. If education helps people to better understand the world around them, and to better identify accurate information, then we should expect that people with higher levels of education will be more likely to say that vaccines are safe. So that’s going to be my first hypothesis. At the same time, attitudes towards vaccine safety have become highly politicized, and the Republican and Democratic parties differ in terms of the average educational attainment of their members. As a result, I’m worried that whatever I find might be partially due to differences in party affiliation between people with higher and lower educational attainment, so I want to see if the same associations hold up when I only look at one party at a time. I don’t have any hypotheses about what I’m going to find here.
Analysis
I’m going to take a few steps as a part of this analysis.
Variable Creation
For starters, I want to create dichotomous versions of the variables I’m looking at. The tools we’ve developed are easiest to work with when the categorical variables have exactly two levels. Later in the course we’ll have the ability to handle more complex variables, but for now this is fine. I’m going to measure education (the degree variable in the GSS dataset) as either “no bachelor’s degree” or “has a bachelor’s degree”. This is obviously a very simplified version of the variable, but it’s a common approach. If you think this is a mistake, rerun the analysis using a different cut-off! For the attitudes towards vaccine safety variable (vaxsafe in the GSS), I’m going to going to distinguish between people who agreed with the statement that “Vaccines are safe” (whether they agreed or strongly agreed) and those who did not (whether they strongly disagreed, disagreed, or neither agreed nor disagreed). Again, this is a choice I’m making, and you can definitely approach it differently if you want. For the party membership (the partyid variable) I’m going to look at people who said they were Democrats (strong or not very strong) and independent but close to Democrats, and people who said they were Republicans (strong or not very strong) and independent but close to Republicans.
Code
library(dplyr) # as before, these need to be installed before libraryinglibrary(tidyr)table(gss$degree) # I just want to see what the values are
        less than high school                   high school
                          417                          1919
     associate/junior college                    bachelor's
                          367                           866
                     graduate                    don't know
                          578                             0
                          iap            I don't have a job
                            0                             0
                  dk, na, iap                     no answer
                            0                             0
   not imputable_(2147483637)    not imputable_(2147483638)
                            0                             0
                      refused                skipped on web
                            0                             0
                   uncodeable not available in this release
                            0                             0
   not available in this year                  see codebook
                            0                             0
Code
table(gss$vaxsafe)
               strongly agree                         agree
                          407                           430
   neither agree nor disagree                      disagree
                          332                            43
            strongly disagree                    don't know
                           20                             0
                          iap            I don't have a job
                            0                             0
                  dk, na, iap                     no answer
                            0                             0
   not imputable_(2147483637)    not imputable_(2147483638)
                            0                             0
                      refused                skipped on web
                            0                             0
                   uncodeable not available in this release
                            0                             0
   not available in this year                  see codebook
                            0                             0
Code
table(gss$partyid)
                   strong democrat           not very strong democrat
                               710                                593
    independent, close to democrat independent (neither, no response)
                               479                                971
  independent, close to republican         not very strong republican
                               366                                417
                 strong republican                        other party
                               459                                118
                        don't know                                iap
                                 0                                  0
                I don't have a job                        dk, na, iap
                                 0                                  0
                         no answer         not imputable_(2147483637)
                                 0                                  0
        not imputable_(2147483638)                            refused
                                 0                                  0
                    skipped on web                         uncodeable
                                 0                                  0
     not available in this release         not available in this year
                                 0                                  0
                      see codebook
                                 0
Code
gss <- gss %>%drop_na(degree, vaxsafe) # we only want to keep people who gave responses to these items; the GSS only presents a subset of the items to each person, so a lot of the respondents won't be a part of our analysis.# recode the variables and only keep levels which have responsesgss$bachelors <-recode(gss$degree, 'less than high school'='no bachelors', 'high school'='no bachelors', 'associate/junior college'='no bachelors', 'bachelor\'s'='bachelors', 'graduate'='bachelors') %>%droplevels()gss$vaxsafe_simple <-recode(gss$vaxsafe, 'strongly agree'='agree', 'neither agree nor disagree'='disagree', 'strongly disagree'='disagree') %>%droplevels()# create the Democrat and Republican specific datasetsgss_dem <- gss %>%filter(partyid %in%c('strong democrat', 'not very strong democrat', 'independent, close to democrat'))gss_rep <- gss %>%filter(partyid %in%c('strong republican', 'not very strong republican', 'independent, close to republican'))
Univariate Statistics
Next, I’m going to get some descriptive statistics for the variables. We’ll report on things like the sample size, and the proportion of people who agreed that vaccines are safe.
A total of 1,232 respondents on the GSS responded to the vaccine safety and degree items. Of these, 837 (68%) agreed or strongly agreed that vaccines are safe and 395 (32%) neither agreed nor disagreed, disagreed, or strongly disagreed. So a majority of respondents agreed that vaccines are safe, but a fairly large minority did not agree.
Republicans and Republican-leaning independents were substantially less likely to agree the vaccines are safe. Of the 376 respondents, only 204 (54%) agreed that vaccines are safe, while 172 (46%) disagreed.
The Association
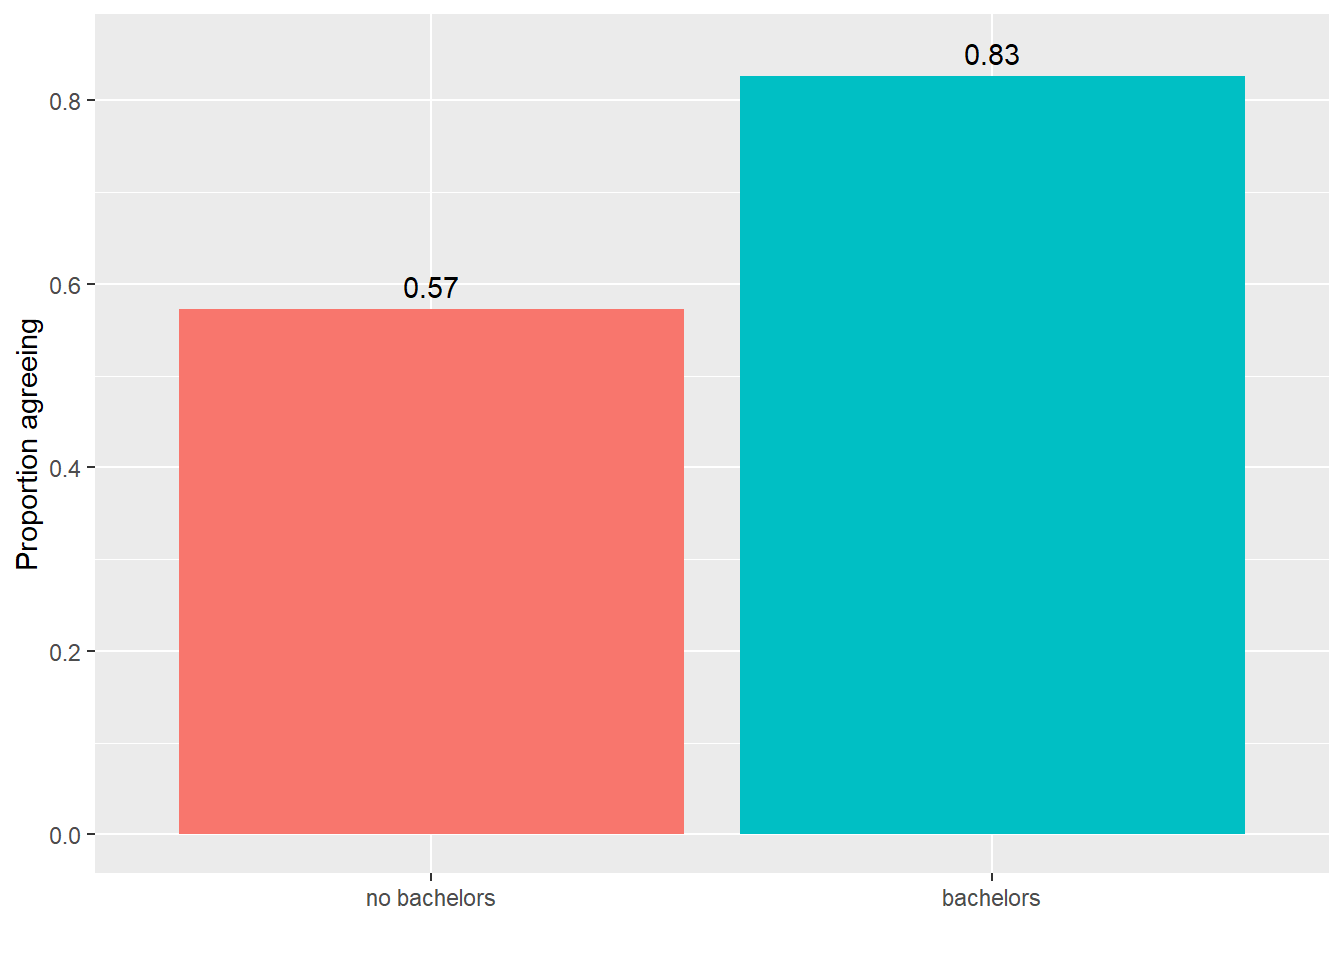
Next, I’m going to look at the association between having a degree and attitudes towards vaccine safety. I’m going to find the proportion of people with bachelor’s degrees who agree that vaccines are safe, and the proportion of people without bachelor’s degrees who agree that vaccines are safe. Note that we could find the proportion of people who agree that vaccines are safe who have bachelor’s degrees, and the proportion of people who do not agree that vaccines are safe who have a bachelor’s degree, but that seems less intuitive.
library(ggplot2)data <- tab %>%data.frame()data %>%filter(vaxsafe_simple =='agree') %>%ggplot(aes(x = bachelors, fill = bachelors, y = Freq)) +geom_col() +geom_text(aes(label =round(Freq, 2)), nudge_y = .025) +labs(x ='', y ='Proportion agreeing') +guides(fill ='none')
As hypothesized, people with a bachelor’s degree are substantially more likely to agree that vaccines are safe. In our sample, 83% of respondents with a bachelor’s degree agreed that vaccines are safe compared to only 57% of those without. This is close to the difference between Democrats and Republicans, but that’s purely coincidence.
Testing
At this point I want to see if the association I detected might be due just to chance. If there’s no association in the population, we can still take a sample where just due to chance there’s a difference in agreement between degree holders and non-degree holders. We’ll use a chi-squared test to test for an association.
    Pearson's Chi-squared test with Yates' continuity correction

data:  .
X-squared = 87.355, df = 1, p-value < 2.2e-16
We rejected a null-hypothesis that agreeing that vaccines are safe is independent of holding a bachelor’s degree (\chi^2(df = 1) = 87.4, p < .001), and found that people with a bachelor’s degree are more likely to agree that vaccines are safe than those without.
Subsets
Finally, we’re going to look at our Democrat and Republican subsets separately. We could do tests in these groups as well, but I’m not going to because it’s not as interesting to me.
The general pattern that people with bachelor’s degrees are more likely to agree that vaccines are safe holds in our subset of Democrat respondents and our subset of Republican respondents. Democrats are, in general, much more likely to agree that vaccines are safe; 91% of Democrats with bachelor’s degrees agree that vaccines are safe compared to 74% of Democrats without bachelor’s degrees. Among Republicans, 67% of respondents with a bachelor’s degree agree that vaccines are safe, compare to 47% of those without a bachelor’s degree. One somewhat surprising finding is that the partisan difference is larger than the education-based difference. Democrats are almost 25 percentage points more likely to agree that vaccines are safe than their Republican peers of the same educational attainment. However, among both Democrats and Republicans, those with bachelor’s degrees are a little less than 20 percentage points more likely to agree than those without. In fact, Democrats without a college degree are slightly more likely to agree that vaccines are safe than Republicans with a college degree.
Limitations
In addition to reporting what we found, we want to be clear on what we haven’t found. This is useful both for our audience and for our own understanding.
Here are a few limitations to our analysis. First, we should be clear that we’re not saying that getting a bachelor’s degree causes people to be more likely to agree that vaccines are safe, just that people with bachelor’s degrees are more likely to agree. Although there certainly could be a causal association, there are other possible explanations. Second, our results could in theory be dependent on how we split the variables. For example, if we had put people who neither agreed nor disagreed into the agree group, we might have gotten very different results. Third, it’s not entirely clear what people mean when they say they don’t agree that vaccines are safe. In general, vaccines are extremely safe. However, they often come with negative side effects, like (generally non-serious) fevers, headaches, and fatigue. And there are a very few people for whom specific vaccines actually are dangerous. So in theory, a person might not agree with the statement that vaccines are safe because they’re thinking of these situations.
What’s next?
What’s missing from this analysis? What else would you like to learn about? Send an e-mail to joseph_mcintyre@gse.harvard.edu if you have questions or suggestions!